for Nevada Report Card
Students
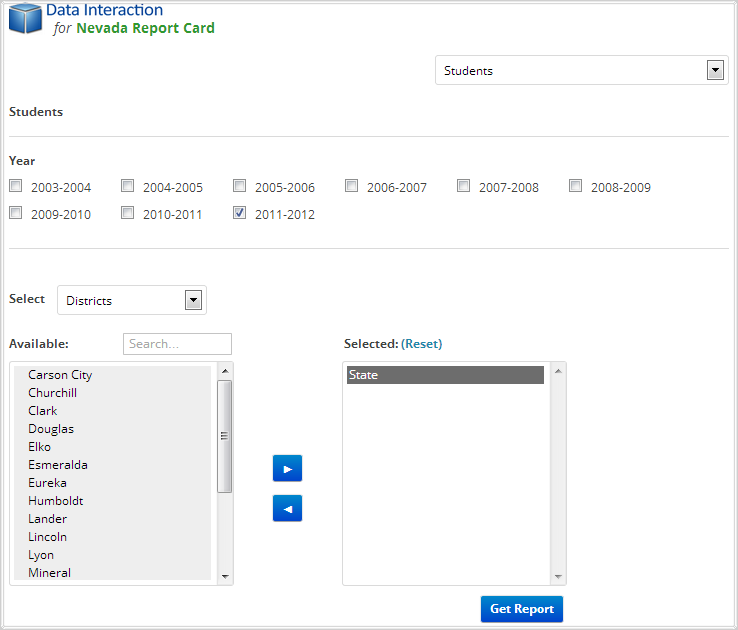
Getting Started
The Students Report provides data on students ADA, Student/Teacher Ratio, Average Class Size, Retention by Grade, Credit Deficiency, Transiency, Discipline, Proficiency Failures (HSPE) and Remedial HSPE at the school, district and state level. To get started:
- Select "Students" from the home page.
- Select the desired years to view under "Year."
- Select State, district(s) and/or school(s).
- Click "Get Report" to generate a report with default selections (you can later customize your report on the report page itself).
Sample Report
Clicking "Get Report" will generate a report similar to the following sample: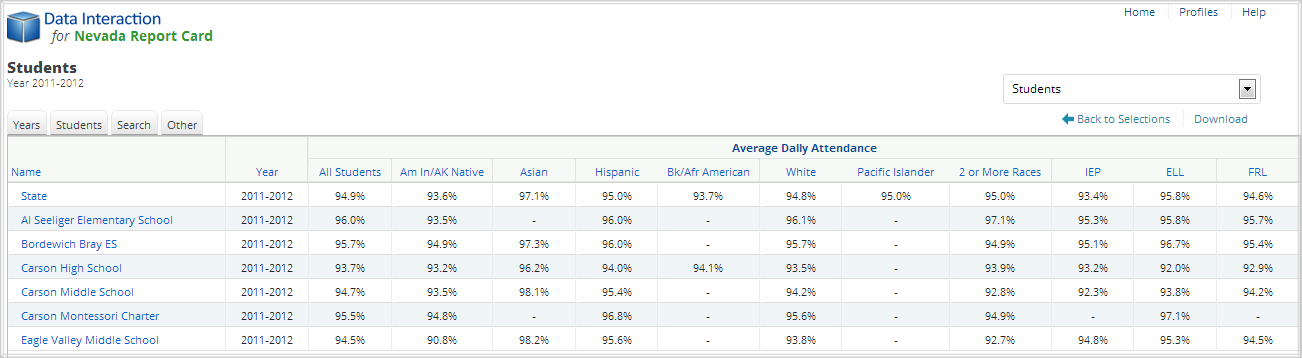
Using the Customization Tabs
The tabs at the top of the table allow for quick modification and customization of reports. Changes may be made to multiple tabs at once before clicking “Update.”
-
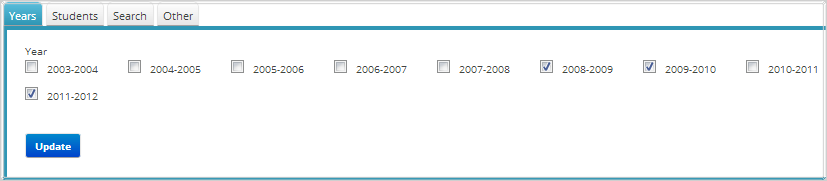
Years
This feature allows for selection of multiple years of data to show in the report. For example, to compare student data for 2009 and 2010, select "2008-2009" and “2009-2010” and click "Update."
-
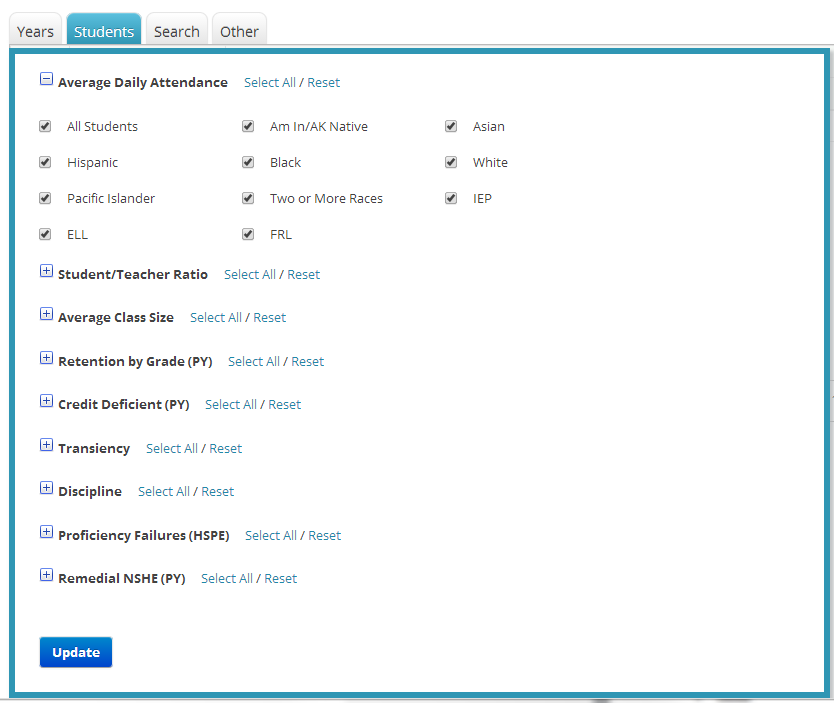
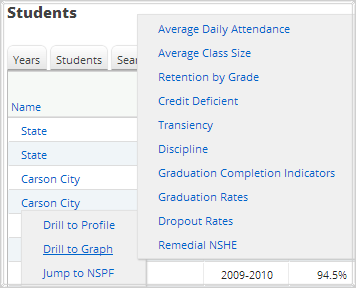
Students
The Students tab allows for selection of additional variables related to students to be shown in the report. For example, to view the Average Daily Attendance for All Students and subgroups, select "All Students" and each of the subgroups, or “Select All” under the "Average Daily Attendance" heading and click "Update."
-
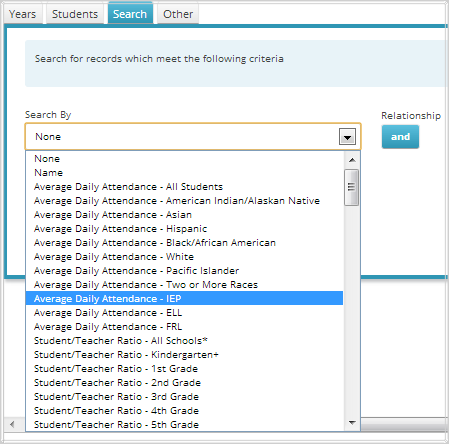
Search
Use this feature to search records by any of the variables listed on the Students tab. To include one or more criterion, click on the variables from the drop-down menu and then click on the relationship "and” or “or” to specify the logical relationship between the subgroups selected. “And” will only show students who fall under all of the characteristics selected whereas “or” will show students who fall under any one or more of the characteristics.
-
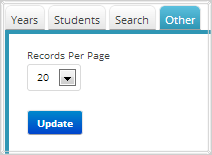
Other
Use this tab to change the number of students shown per page.
Advanced Features
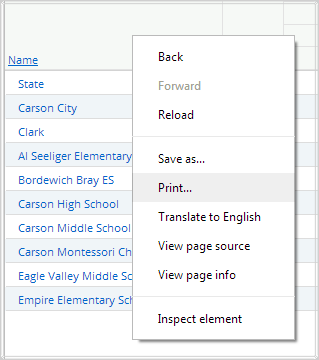
Once you view your report, you can further:- Print it directly from your browser. You can also download it as an Excel CSV or
PDF file. An Excel CSV is simply a text-file that opens directly in Microsoft Excel.
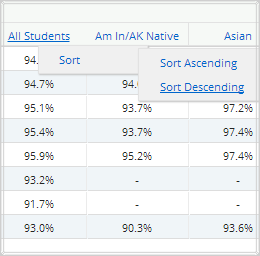
- Sort the report by clicking the column of interest, then on “Sort.” For example,
to see the groups with the highest Average Daily Attendance first, click on the
column header for “All Students” under “Average Daily Attendance,” click “Sort”
and “Descending” as shown below:
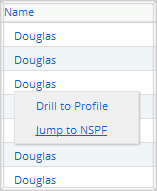
- Drill to Schools: Click on a district group in the report and select "Drill to
Schools" to view all schools in the selected district on the current report.
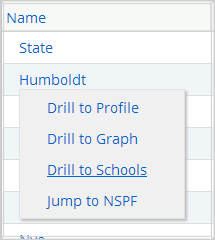
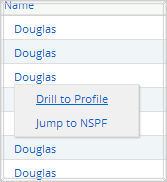
- Drill to Profile: Click on any group in the report and select "Drill to Profile"
to view the overall Profile of the selected School, District or State.
- Drill to Graph: Click on any group in the report and select "Drill to Graph" to
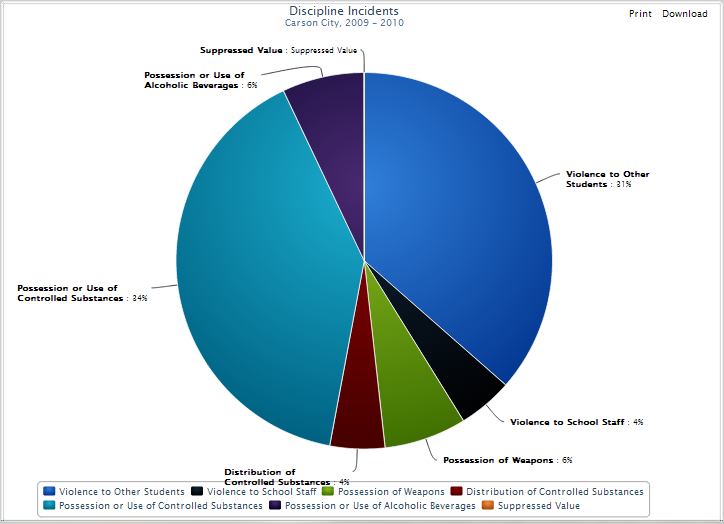
view a pie chart of the demographic composition of the selected group.
- Pie Chart: The pie chart may be printed or downloaded by clicking on the links on the top right of the page.
- Jump to NSPF: Click on any group in the report and select "Jump to NSPF" to open
a new window with the corresponding NSPF report for the selected group.