for Nevada Report Card
State Assessment:Group Summary
Getting Started
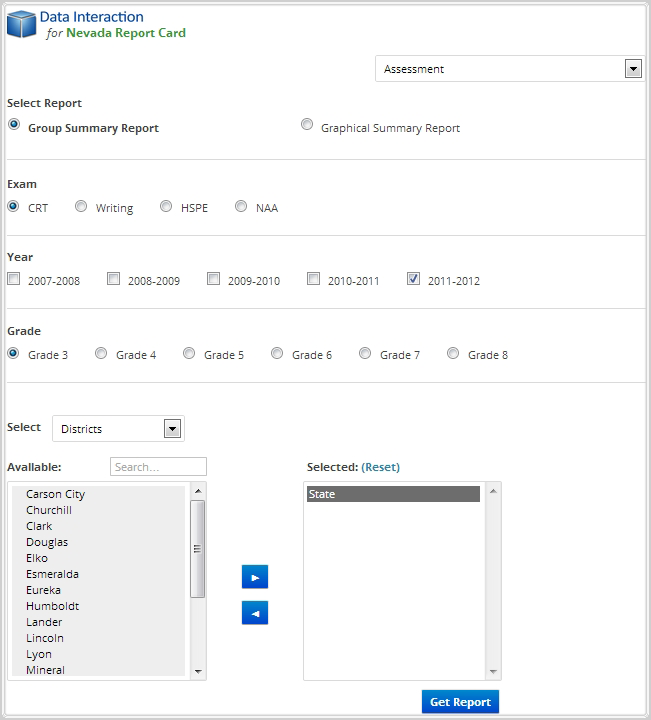
The State Assessment Reports provide data on the CRT, Writing, HSPE and NAA assessments. A Group Summary and Graphical Summary report is available for each assessment. To get started:
- Select "State Assessments" from the home page.
- Select the report type (Group Summary).
- Select the desired years to view under "Year."
- Select the desired grade to view under “Grade.”
- Select State, districts and/or school(s).
- Click "Get Report" to generate a report with default selections (you can later customize your report on the report page itself).
Sample Report
Clicking "Get Report" will generate a report similar to the following sample: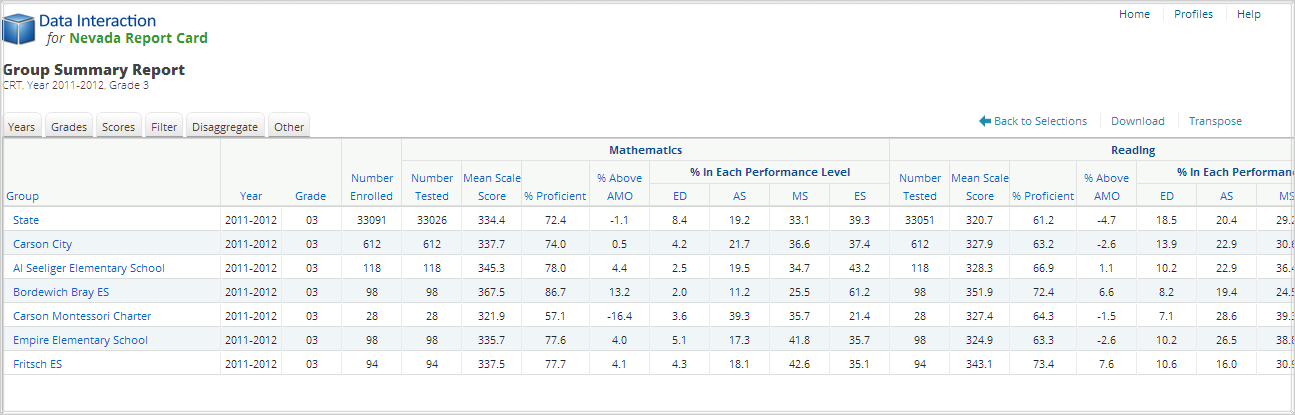
Using the Customization Tabs
The tabs at the top of the table allow for quick modification and customization of reports. Changes may be made to multiple tabs at once before clicking “Update.”
-
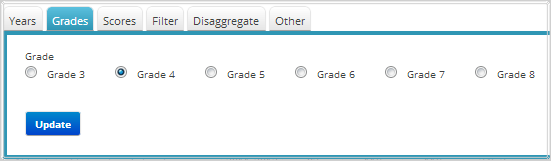
Grades
This feature allows user to change the selection of which grades are shown in the report. For example, to view data for grade 4, select “Grade 4” and click "Update."
-
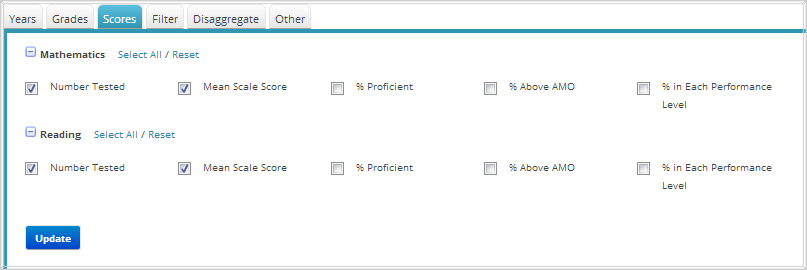
Scores
This feature allows for the selection of which scores are shown in the report. For example, to compare the Mean Scale Scores for Mathematics and Reading, select “Mean Scale Score” under the heading for Mathematics, select “Mean Scale Score” under the heading for Reading and click "Update."
-
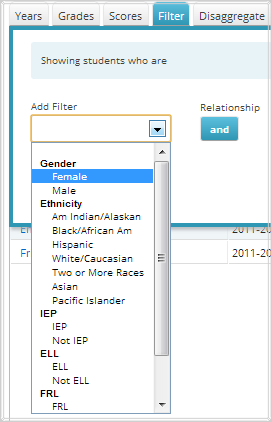
Filter
Use this feature to include or exclude students based on demographic characteristics. To include a subgroup, click on the desired demographic variable from the drop-down list. To select more than one subgroup, simply click on another demographic variable. Click on the word “and” or “or” to specify the logical relationship between the subgroups selected. “And” will only show students who fall under all of the characteristics selected whereas “or” will show students who fall under any one or more of the characteristics.
For instance, to view students who are either Asian or female, select “Female” and “Asian”. Then, click the “and” link, which is automatically selected, to change to “or” and click “Update.”
-
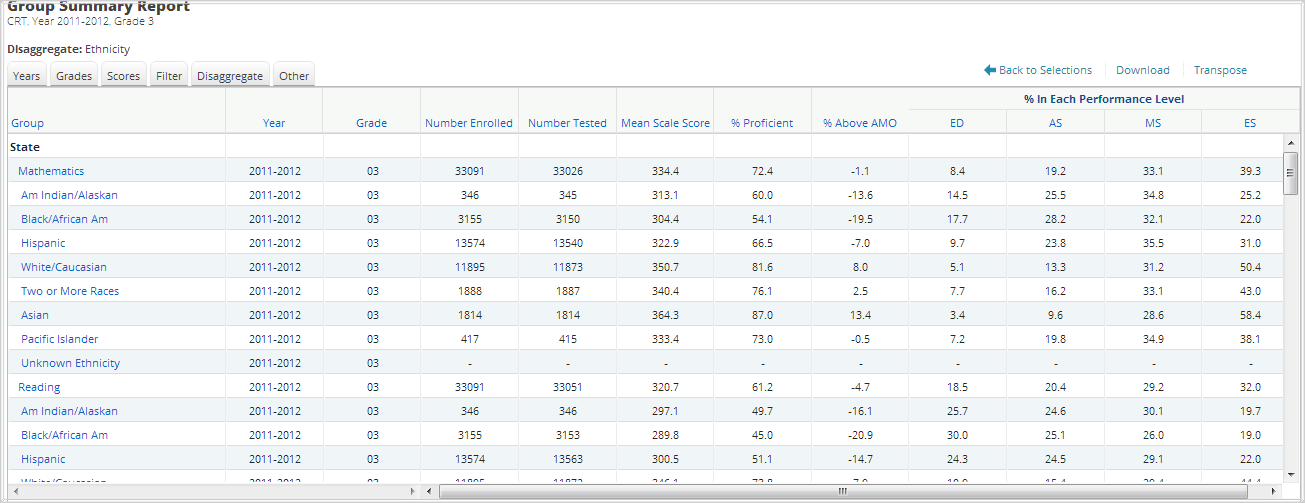
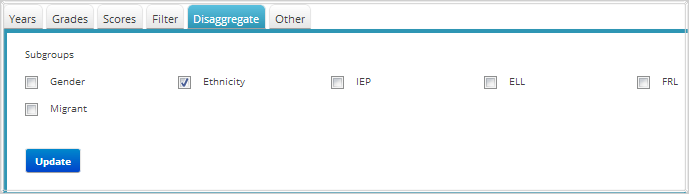
Disaggregate
Use this feature to disaggregate the report by different subgroups. For example, to see statistics for different ethnicities, first select "Ethnicity" and then click "Update."
-
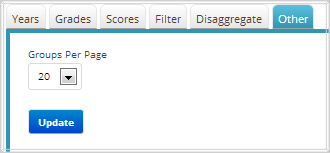
Other
Use this tab to change the number of students shown per page.
Advanced Features
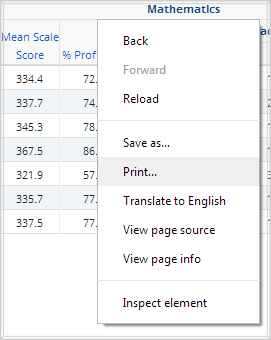
Once you view your report, you can further:- Print it directly from your browser. You can also download it as an Excel CSV or
PDF file. An Excel CSV is simply a text-file that opens directly in Microsoft Excel.
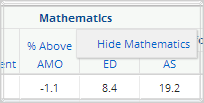
- Click on a score type column header (i.e.: Mathematics) to hide the score type.
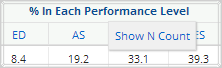
- Show N-Counts for Percentages: To see how many students scored in each performance
level under a particular subject, ensure that “% in Each Performance Level” is shown
on the report (found under the “Scores” tab). Click the “% in Each Performance Level”
column heading. Then, click “Show N Count.”
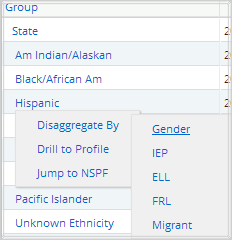
- Drill Down Disaggregation: You can disaggregate a visible group by a number of
demographic variables. For instance, if you have generated a report that is disaggregated
by ethnicities and would like to further analyze this group by the Hispanic students’
gender, click on “Hispanic,” then “Disaggregate By,” then “Gender.”
- Drill to Schools: Click on a district group in the report and select "Drill to
Schools" to view all schools in the selected district on the current report.
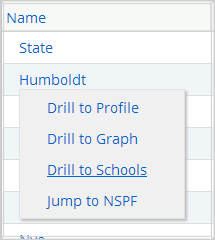
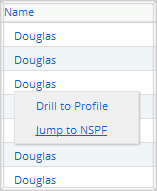
- Drill to Profile: Click on any group in the report and select "Drill to Profile"
to view the overall Profile of the selected School, District or State.
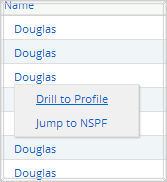
- Jump to NSPF: Click on any group in the report and select "Jump to NSPF" to open
a new window with the corresponding NSPF report for the selected group.
- Transpose: Click “Transpose” to change the layout of the report. For example: